I just had a wonderful Sustain What visit with “Deep Sea Dawn” Wright - a brilliant oceanographer, explorer, role model, and chief scientist at Esri - to discuss her efforts to map the world’s assets and risks and convey the importance of oceanic and planetary stewardship.
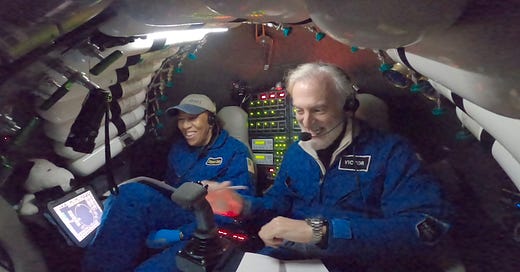
Wright has a fascinating book out, Mapping the Deep, conveying her life in science and her 2022 journey to the deepest spot in the ocean, the Mariana Trench, as mission specialist aboard Limiting Factor, a submersible built by the explorer and entrepreneur Victor Vescovo. Wright, who was already a widely honored role model for young people became the first Black person to make that deepest voyage.
You can watch on X/Twitter, LinkedIn, Facebook and YouTube:
As we wrapped our conversation on ocean exploration, geodesign for resilience and so much more Wright and I talked about the importance of direct wet experience with the ocean as a path to progress - something I wrote on a couple of years ago. I recalled witnessing the percussive magic of Vanuatu women's water music, and offered the idea that we spread the practice far and wide. Here’s that part of the conversation.
It’s never been more important to map the ocean depths - which remain far less well understood than the surface of the Moon. For starters, think about the rush for strategic metals on the seabed (as I explored with a great panel here).
We need more people like Wright and companies like Esri, one of the giant businesse you rarely hear about because its products are so ubiquitous they are invisible. In this case, the stock in trade is GIS, or global information system, software and mapping tools. Here’s what one tool, ArcGIS, can do (from their website):
One of the company mantras is that “geography is at the heart of a more resilient and sustainable future.” I couldn’t agree more!
We’ll talk about the gaps between data and decisions.
From data to decisions using mapping
Our planet is more observed and understood every day, with layers upon layers of data, new and old, potentially providing clear signs of danger, and opportunity, facing communities and ecosystems worldwide.
But unfortunately, all too often, risk is obscured as the pull of realtime interests in development and convenience hides available knowledge. And of course there’s the superstorm of fakery and digital distraction.
The tools and practices of geographers can pull signal out of noise by layering different data sets and using physical and social sciences to pull out meaning.
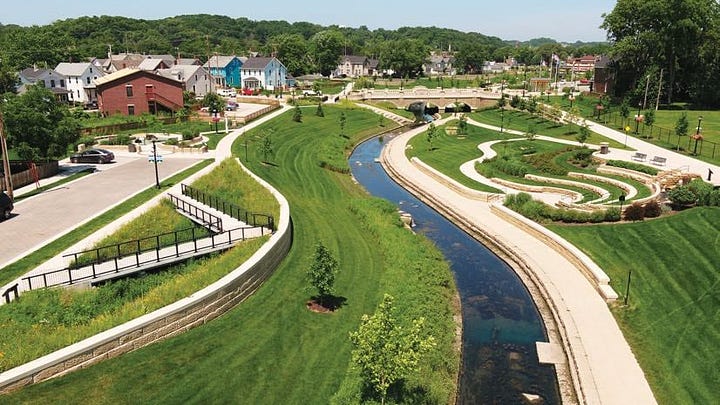
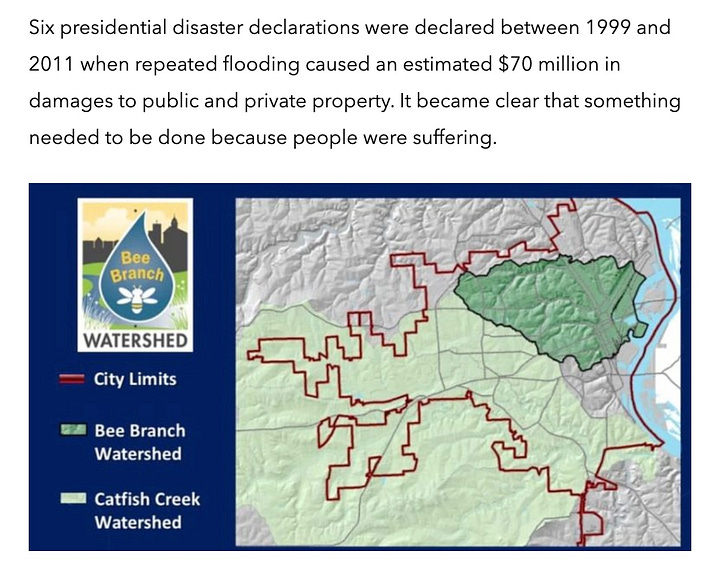
Here’s just one example showing how Esri tools helped Dubuque, Iowa, reduce chronic flooding risk in a disadvantaged neighbhorhood.
There are hundreds more.
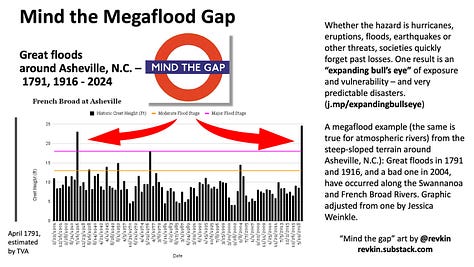
I’ve lost track of how many times have I posted here and on social media about the revealing “expanding bull’s eye” analysis of Stephen Strader and Walker Ashley - showing how bursts of settlement and investment in known hazard zones are the prime drivers of risk and loss when the worst happens. This is Strader’s simplest illustration of the dynamic - with the path of a tornado time-traveling as a community grows in density and sprawl. Same tornado, vastly worse outcomes (if people are living in vulnerable housing).
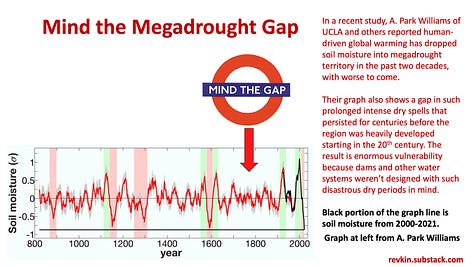
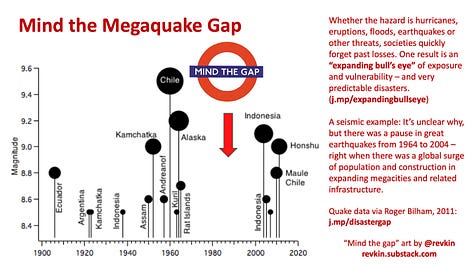
And I’ve also written ad nauseum about insights from climate and geological hazard research looking at past worst-case threats like unthinkable deluges, wildfire, earthquakes and the rest. Communities sprawl. Leaders focus on growth and deny history. Climate campaigners blame any meteorological extreme on global warming. Too often the fail the “mind the gap.” Geography can help fill that gap.
