How Risk in Climate Danger Zones Can Skyrocket With or Without Climate Change
Check your community's "expanding bull's eye"
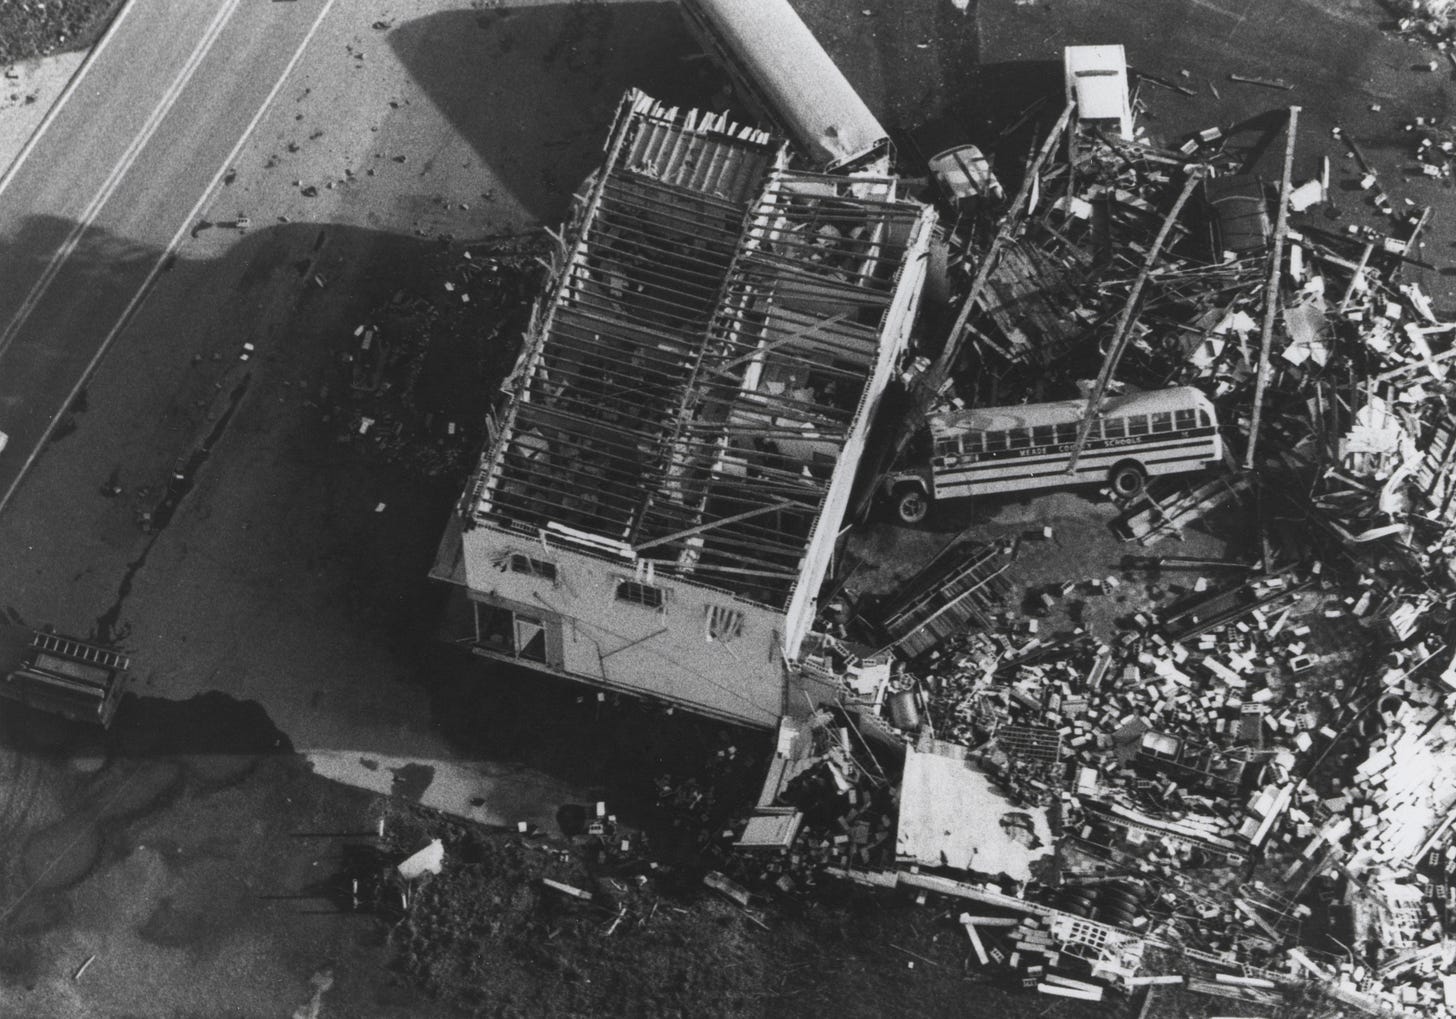
Fifty years ago, the midwest experienced one of America’s most harrowing tornado “super outbreaks” and there’s no reason, climatologically, that can’t happen again. (I always think of the awful tornado luck of Moore, Oklahoma.) With this in mind, let’s look at what’s changed in the region affected back in 1974.

I’ve been a fan of the important science and risk-communication efforts of Villanova geographer Stephen M. Strader since 2017, when I cited his work in a ProPublica story on Development and Disasters. He said something then that I wish more climate-focused campaigners (and journalists) would keep in mind:
“What gets lost in climate change debates is that society is changing, too.”
Even a perfect policy tamping down or sopping up heat-trapping gases would be meaningless if people continue to settle and build in zones of implicit hazard - some of which are changing because of global warming but many of which are not.
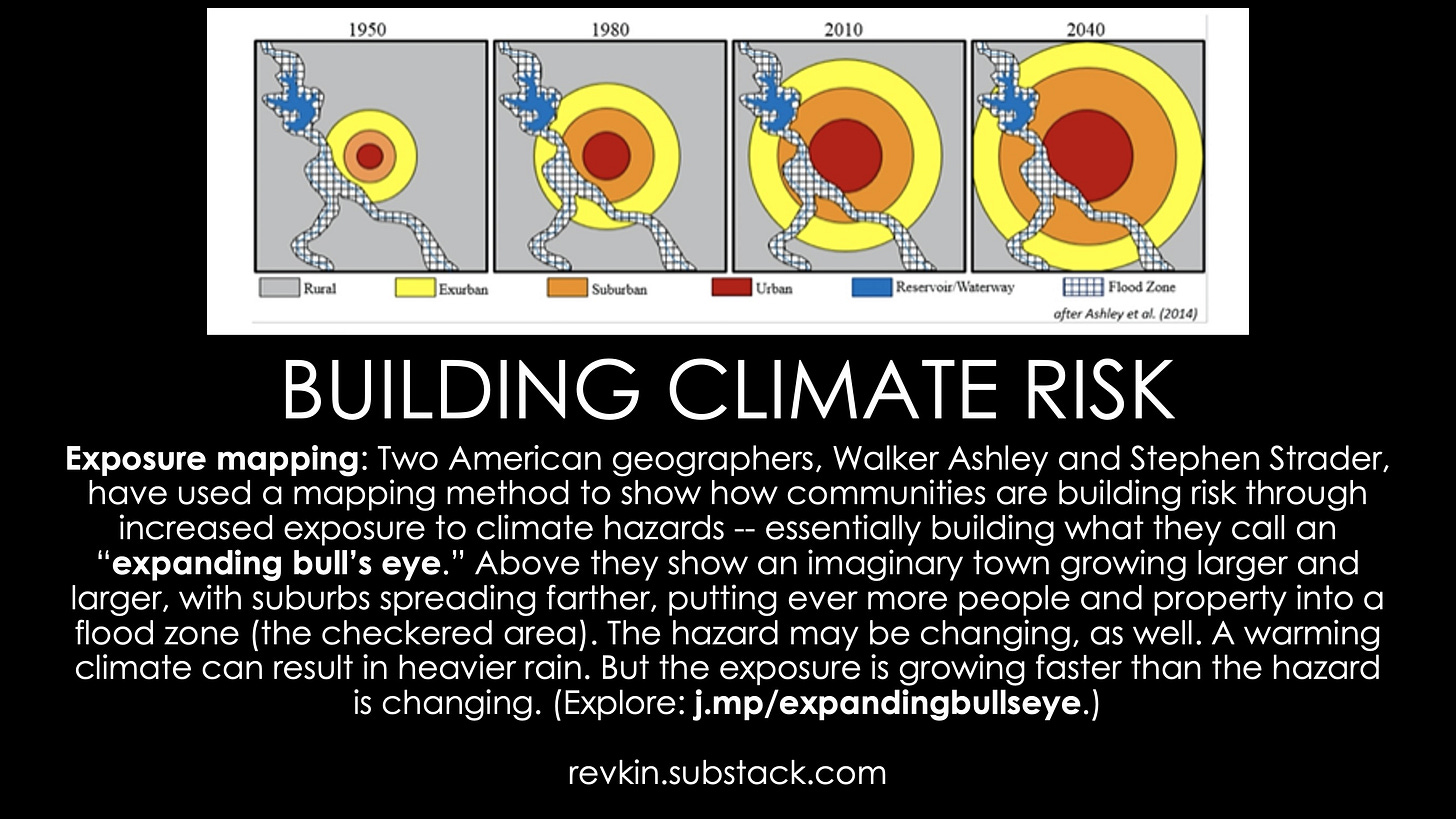
Today on X/Twitter, Strader posted this animated “expanding bull’s eye” time machine showing how the number of homes in the zone devastated by the astonishing 1974 “super outbreak” of tornadoes has gone from 12,000 to 30,000.
Strader has refined this mapping method for years with research partner Walker Ashley at Northern Illinois University and applied it to everything from crowding wildfire, flood and hurricane danger zones to the crowding communities around Seattle’s sleeping, but deadly, volcanoes.
No substantial trends in tornado activity across the United States (or globally) that have been linked to human-driven global warming. Trends in losses from tornado impacts, however, have been robustly linked to settlement patterns, lousy construction and the rest (as I’ve been reporting and reporting).
1:30 pm ET insert - I’m adding a paragraph to point to the important work of Roger Pielke Jr. and coauthors showing that normalized tornado losses (estimating what past tornado years would have cost if all had the level of exposed property of a chosen year) have declined a bit, and that the cost of the 1974 outbreak and other tornadoes in 1974 would have come in at $16 billion or so if 2021 levels of population and development had been in harm’s way back then. - end insert
Even for environmental hazards where global warming is implicated, an emissions-focused policy would take decades to modulate community risk without attending to exposure of people and property to those hazards and thee level of vulnerability or resilience. Remember the inertia factor in climate policy.
So please do check your own set of hazards and see what on-the-ground human factors are doing to worsen (or lower) exposure and vulnerability to the threats. Here are a couple of digital “pocket cards” I’ve made that might help:
And here’s a valuable conversation I ran on America’s risky relationship with tornadoes, focused on the flimsy mobile and manufactured homes spreading across the stormy South.
Seeking Safer Shelter as Death Counts Rise in America's Shifting Tornado Danger Zones
INSERT, 4/7 - Watch my Columbia Climate School Sustain What webcast with some of America's top experts on how to build safer in tornado danger zones. I was joined by Daphne LaDue of the University of Oklahoma, Ian Livingston of the Washington Post’s Capital Weather Gang blog, the “expanding bull’s eye effect” researchers
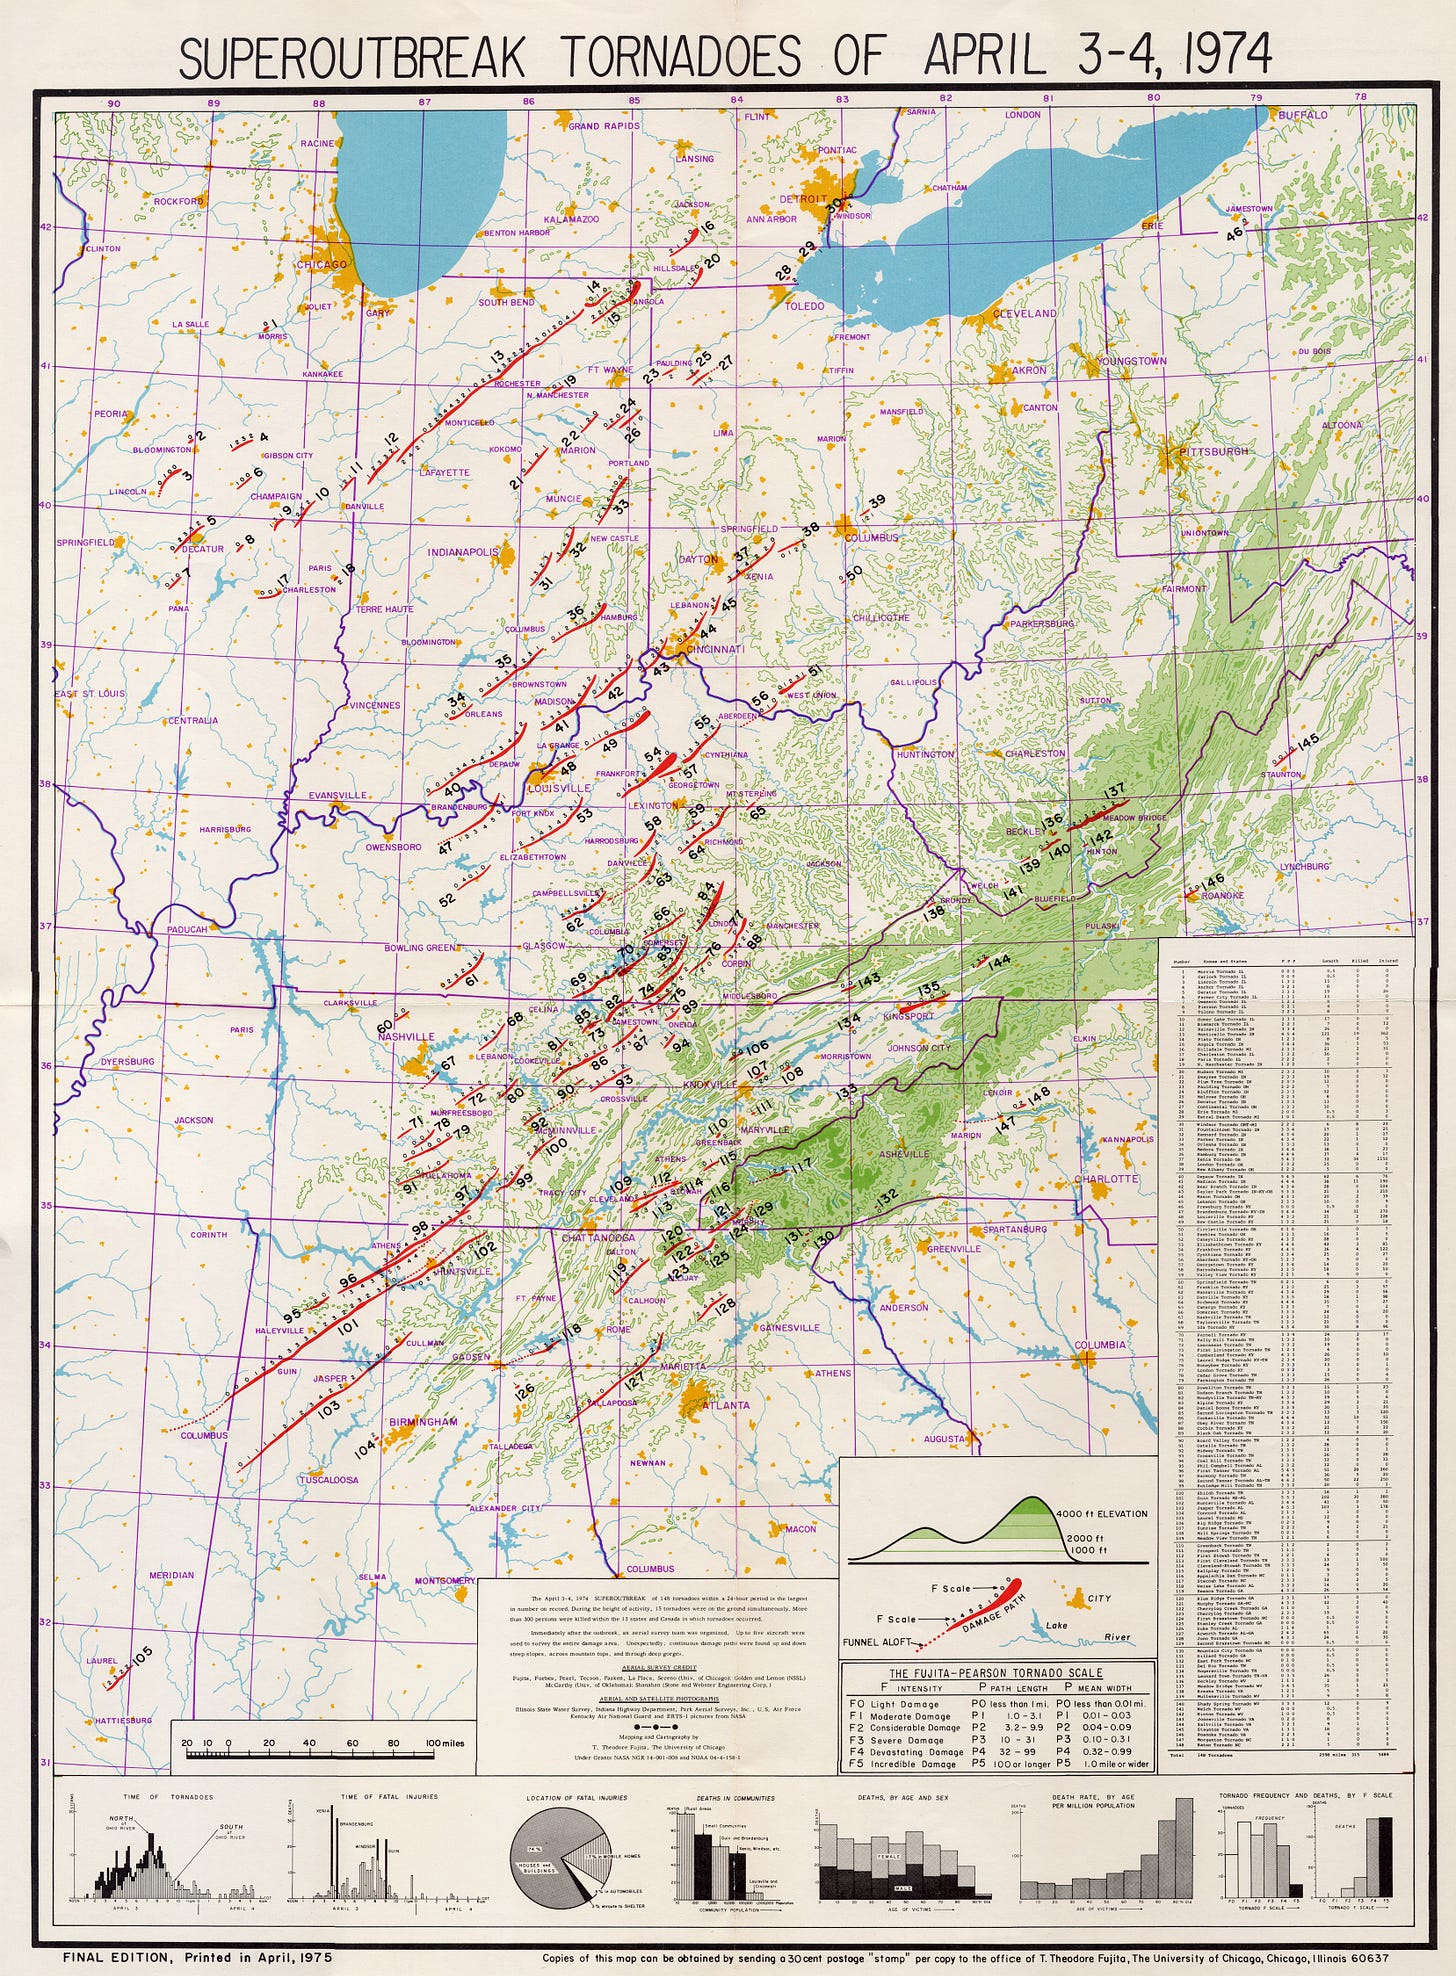
Finally, please be sure to read a wonderful reflection about the 1974 outbreak posted by veteran tornado-focused meteorologist Mike Smith. He focuses on the investigative aftermath, led by the pioneering tornado scientist Ted Fujita, who is best known as the name behind the F scale of tornado damage but had far wider impacts on the field of severe storm meteorology. The story behind Fujita’s meticulously researched map of the mega disaster is truly remarkable:
And even more finally, this Yale Climate Connections post by meteorologists Bob Henson and Jeff Masters has reflections on the expanding bull’s eye in tornado country:
How might the next super tornado outbreak play out in tomorrow’s world?
https://yaleclimateconnections.org/2024/04/how-might-the-next-super-tornado-outbreak-play-out-in-tomorrows-world/


